Annual Report 2021: Stories of Impact
Annual Report / Stories of Impact / Beth Blauer

Government Innovation
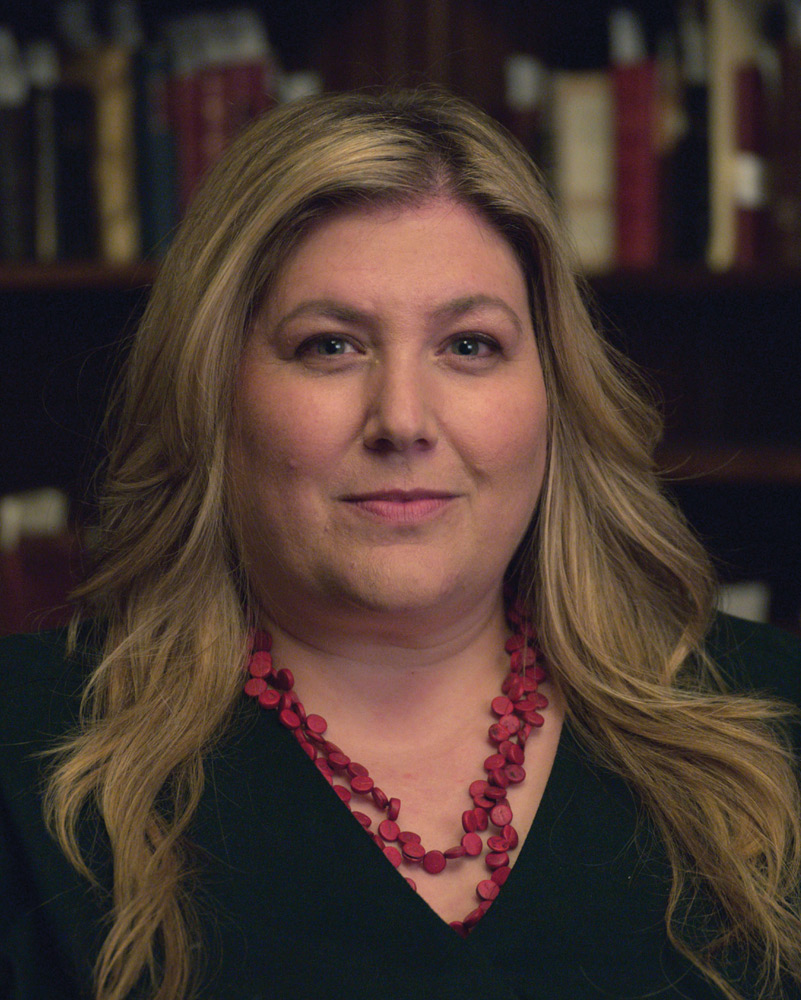
Beth Blauer
Associate Vice Provost for Public Sector Innovation
Johns Hopkins University
When COVID-19 first began to spread around the world, Beth Blauer was one of millions of people who wanted access to the best data on the growing crisis. She was also uniquely positioned to make sure that kind of data was widely available – as a self-described data nerd, an expert in helping governments use data to innovate, and Associate Vice Provost for Public Sector Innovation at Johns Hopkins University.
“It turned out that the best source of information was right here at Hopkins,” she said. The problem, as others in the university told her, was that “we’ve got all this data, but we’re not telling the story in a way that people are immediately getting it.”
Beth and a team of women across the university, including data scientist Dr. Lauren Gardner, came together to tell that story effectively. With support from Bloomberg Philanthropies, the team dug into the data and created an online dashboard – centered around a world map – with an enormous amount of easily digestible information on the pandemic’s spread and severity.
Since its inception, more than 1 billion people have used the map to better understand COVID-19 and make informed decisions in their lives. “These were local conditions that were going to be guiding whether or not you are engaging in public life,” Beth said. “And I think that’s why maps are such a powerful tool for storytelling.”
You can visit the map and learn more here.
For COVID, these were local conditions that were going to be guiding whether or not you are engaging in public life. When you’re looking at a map, you can zoom into your address, into your house, and you can see yourself. And I think that’s why maps are such a powerful tool for storytelling.


